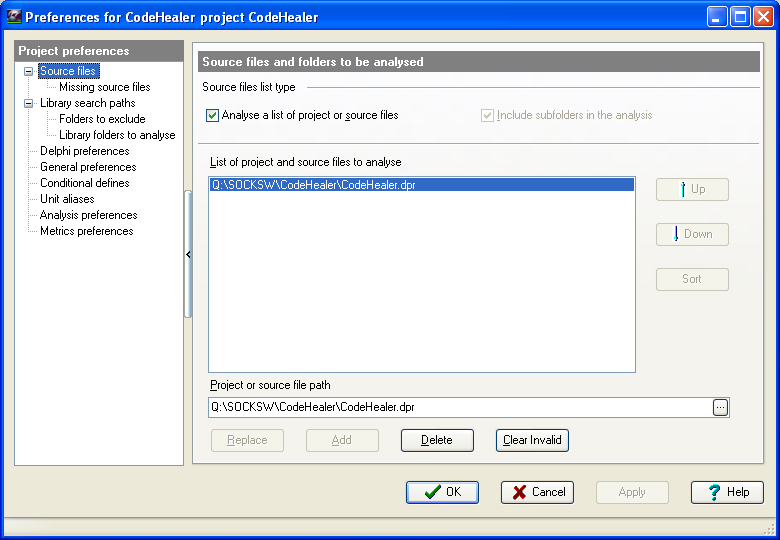
This image shows the selection of the main Delphi project file or source files when creating a
CodeHealer project, and the tree on the left shows the various categories of preference settings
that are available for each CodeHealer project.
|
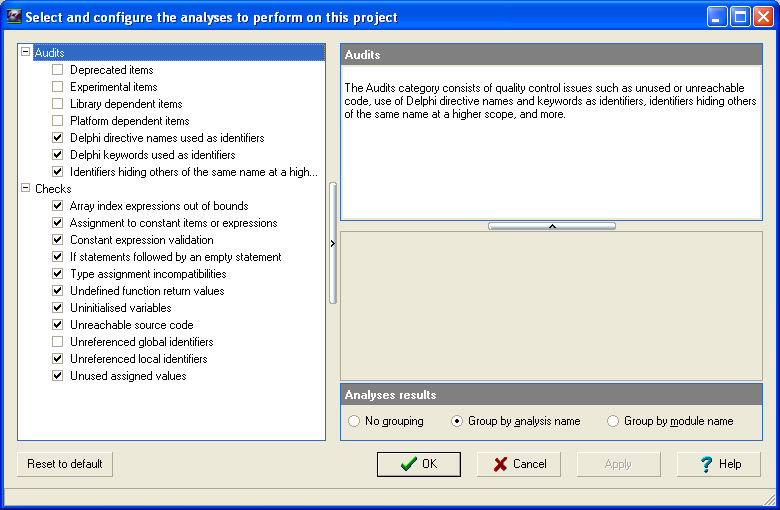
This image shows the selection of the analyses to perform on a CodeHealer project.
|
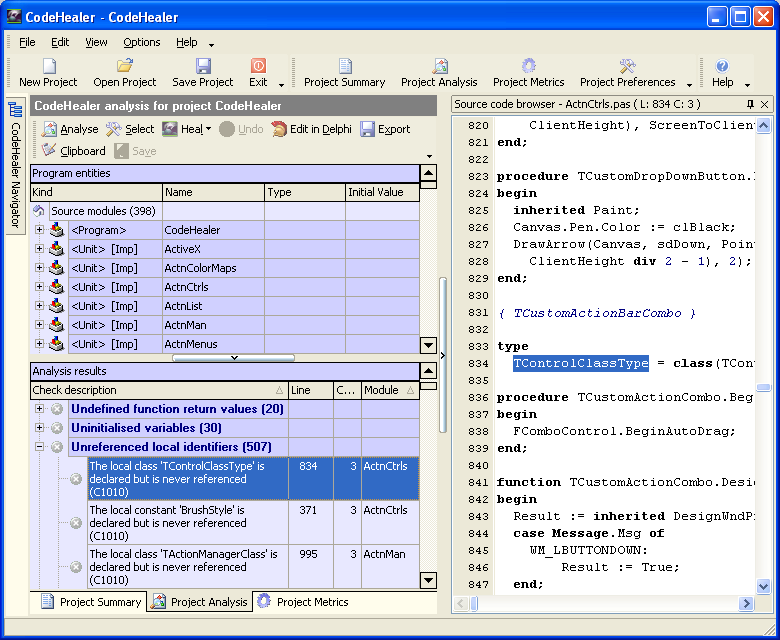
This image shows the results of performing the selected analyses, with the available actions for
each check or audit failure in the actions toolbar at the top left.
The top left panel below the actions toolbar contains a browsable tree of the source modules and
the declarations contained within each module, and the bottom left panel contains the check and
audit failures grouped by analysis name.
The right hand panel contains a source code browser with full syntax highlighting, and this is
automatically positioned on the column or line of the currently selected analysis failure or
source code item.
|
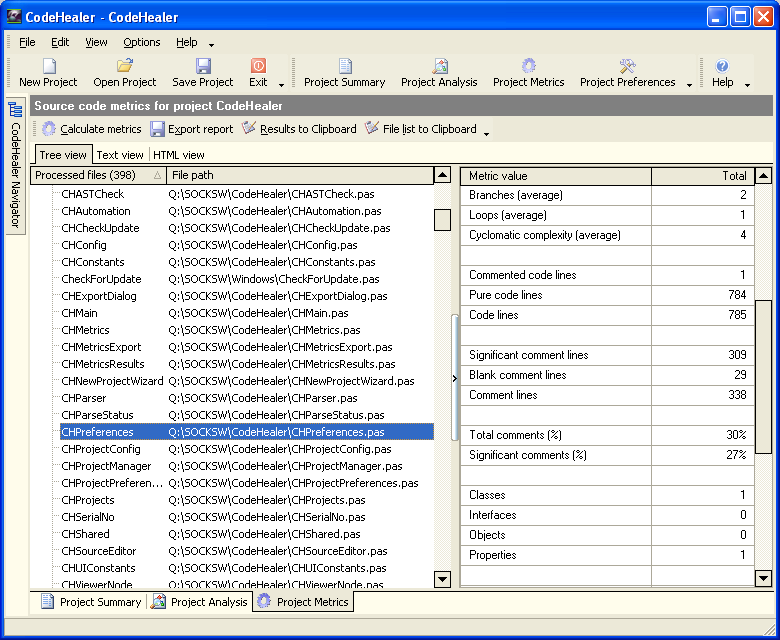
This image shows the results of performing the metrics analysis, with the available actions in
the actions toolbar at the top left.
The left panel below the actions toolbar contains a list of the source modules and their full
paths, and the right hand panel contains a list of the metrics for the whole project or the
selected source module.
|
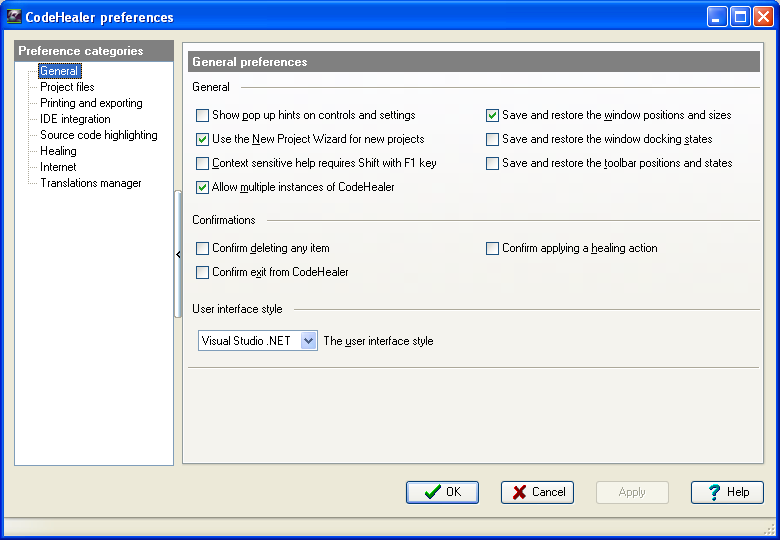
This image shows some of the preference settings that can be used to configure CodeHealer,
and the tree on the left shows the various categories of preference settings that are available.
|
|
|